Level 17 is where your progress bar starts lying to you
Why your progress bar stalls at Level 17, and how to push past the plateau
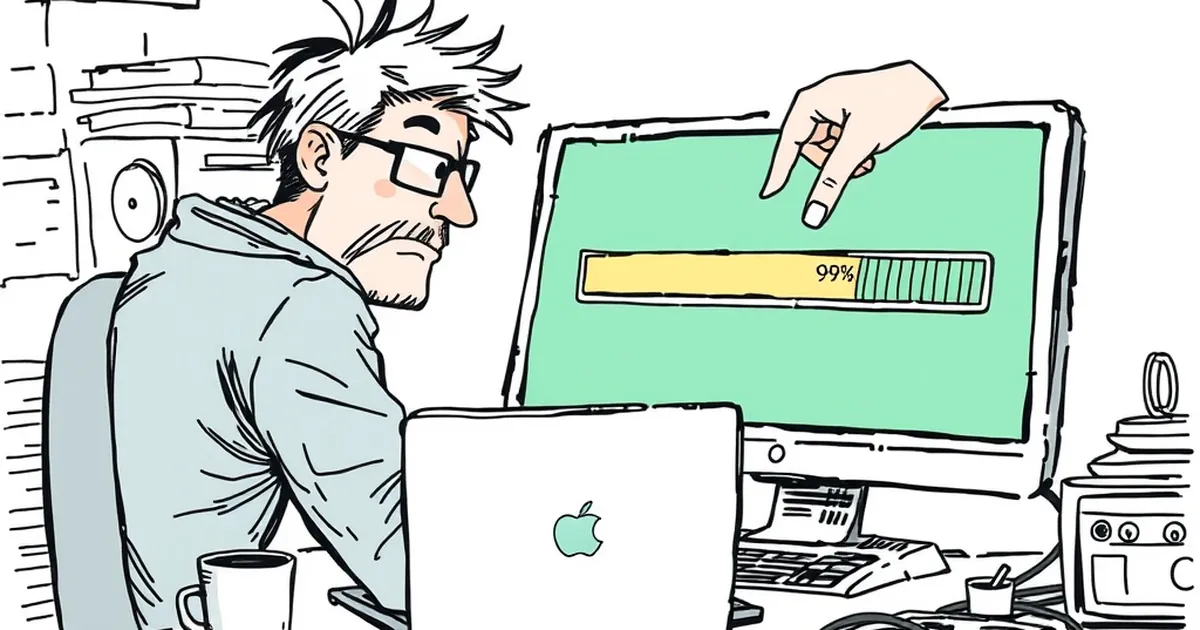
Level 17 is where your progress bar starts lying to you. You’re grinding through a website build, a content calendar, or even a fitness app, and the little green line is moving along nicely. Then, suddenly, it hits a plateau. You’re doing the same work, but the bar barely twitches. It’s not a bug in the software—it’s a bug in your brain.
This is the moment where most small business owners in Australia abandon a project. They’ve sunk ten hours into a new site, the homepage looks great, the menu structure is solid, and then… the contact form integration turns into a swamp. The progress bar says 70%, but it feels like 30%. Why does this happen? And more importantly, why do we trust the bar more than our own experience?
The answer lives in the messy overlap between web development and behavioural psychology. Specifically, it’s about how we perceive progress when the feedback loop stretches and warps.
The Illusion of Linear Effort
When you start a project—whether it’s a website redesign or a new marketing push—you expect a straight line. Effort in, progress out. But that’s not how complex systems work. In web development, the first 50% of a project is often the visible 50%: templates, colours, copy, layout. It feels fast because you’re making decisions that produce immediate visual results.
The next 30% is the ugly middle. This is where you’re dealing with responsive breakpoints, cross-browser quirks, database migrations, and load-time optimisation. None of this shows up on a mockup. You can’t see a 200ms improvement in server response time. But your progress bar—if you’re using a project management tool like Asana or Trello—still counts it.
Here’s the kicker: the bar isn’t lying to you. It’s just using a different metric than your gut. Your gut is measuring dopamine hits from visual novelty. The bar is measuring task completion. And that gap is where frustration breeds.
Why the Plateau Feels Personal
Psychologists call this the planning fallacy, first formalised by Daniel Kahneman and Amos Tversky in 1979. We consistently underestimate how long the middle phase of a project will take because we anchor on the vivid, exciting start. When the bar stalls at 70%, it feels like a personal failure, not a statistical inevitability.
I’ve seen this play out with a client in Brisbane who was convinced their developer was “slacking off” because the site’s front page was done but the backend was a mess. The developer wasn’t slacking—they were wrestling with a payment gateway’s API while also making sure the site didn’t break on a five-year-old iPhone. The progress bar reflected real work. The client’s perception didn’t.
The Variable-Ratio Reinforcement Trap
Here’s where it gets properly interesting for anyone who’s ever built a website or run an online store. The reason the early stages of a build feel so good is that they operate on a variable-ratio reinforcement schedule. This is the same psychological mechanism that makes social media feeds addictive. You don’t know exactly when the next “win” will come—maybe the hero image snaps into place, maybe the menu animation works on the first try—but it comes often enough to keep you hooked.
But web development isn’t designed to sustain that. The middle phase is closer to a fixed-interval schedule, where rewards only appear after a set amount of slog. You might spend three hours fixing a CSS bug and get zero visual payoff. The bar doesn’t move. Your brain interprets this as a loss, and loss aversion kicks in hard.
Kahneman’s work on loss aversion shows that losses hurt roughly twice as much as equivalent gains feel good. So when the progress bar stalls, the perceived loss is double the actual slowdown. That’s why small business owners often abandon projects at 70%—not because the project is doomed, but because the psychological cost of the plateau outweighs the anticipated reward of finishing.
A Concrete Example: The Contact Form Wall
Let me give you a real-world example from a cafe website I consulted on in Melbourne. The owner, let’s call her Sarah, had a beautiful one-page site. She was using a drag-and-drop builder. Her progress bar in the builder’s interface hit 80% in two days. She was thrilled. Then she hit the “contact form” module.
The form required a third-party plugin. The plugin needed an API key. The API key needed a domain verification. The domain verification required a DNS record change that wouldn’t propagate for 24 hours. For three days, Sarah’s progress bar sat at 82%. She was doing everything right. But the bar didn’t move because the task was external—it wasn’t her effort that was slow, it was the internet’s infrastructure.
When I checked in, she was ready to scrap the whole site and start over. I told her to look at the bar differently. The bar wasn’t measuring her work. It was measuring all work, including the invisible plumbing. Once she understood that, she stopped refreshing the DNS checker and went back to writing menu descriptions. The form fixed itself the next day.
Reframing the Progress Bar as a Risk Map
So what do we do with this knowledge? We can’t remove the plateau—it’s inherent to any complex project. But we can change how we interpret it. Instead of viewing the progress bar as a measure of effort, treat it as a risk map. The flat sections are where the uncertainty lives. The bar is telling you, “Here be dragons,” not “You’re failing.”
This is where competitive play comes in. Think of a chess player in a long endgame. They don’t expect a checkmate every move. They expect a series of small, sometimes invisible consolidations of position. The best players actually relish the quiet middle because they know that’s where most opponents lose patience.
You can apply this directly to your web projects. When you hit the 70% plateau, stop focusing on the bar. Switch to a different metric: risk reduction. Ask yourself, “What’s the next thing that could break the whole project?” If it’s the payment gateway, test it now. If it’s the mobile menu, break it on purpose. Each bug you find and squash is a point of certainty added to the system. The bar might not move, but your project’s survival odds just went up.
The “Two Bars” Technique
Here’s a practical trick I use with clients. Create two progress bars in your head—or on a whiteboard. The first is the visible build bar: design, content, layout. The second is the integration bar: APIs, databases, caching, security. Most people combine them into one bar, which is why the plateau feels so brutal. When you separate them, you’ll often find that the integration bar is at 40% while the build bar is at 90%. The combined bar looks stuck, but individually, you’re making steady progress on both.
This does more than reduce anxiety. It changes your decision-making under uncertainty. When you know exactly which bar is lagging, you can allocate resources intelligently. You’re no longer throwing effort at a vague “finish the site” goal. You’re specifically saying, “I need to spend two hours on SSL certificate setup,” which is a concrete, solvable problem.
The Forward-Looking Close
The next time your progress bar hits a plateau, don’t refresh the page. Don’t email your developer. Don’t scrap the project. Instead, walk away from the computer for ten minutes and ask one question: “What would make this project more robust right now, even if it doesn’t look prettier?”
Maybe it’s backing up your database. Maybe it’s writing a fallback page for when the third-party map widget fails. Maybe it’s just documenting your login credentials so you don’t have a heart attack in six months when you need to update a plugin.
The bar isn’t your boss. It’s a lagging indicator, not a leading one. Real progress in web development—and in any complex endeavour—is measured by how many things you’ve de-risked, not by how many pixels you’ve moved. Start treating the plateau as a signal that you’re entering the phase where the work actually matters. The endgame is where the game is won.